Footprint
UX DESIGN • UX RESEARCH
The Footprint Project is an organization that helps other humanitarian relief organizations calculate their carbon footprint, so they can accurately report this required information when applying for government grants and funding. Once the organization finds out it's carbon footprint, the Footprint Project can help them by finding ways to reduce an organization's carbon footprint.
Goal
To create a unified web experience by combining Footprint's online carbon footprint calculator with the main organization website, as well as updating the aesthetics of the online experience.
Process
Interviews • Storyboards • Wireframes • Prototypes
Interviews were conducted with organizations that set policies on humanitarian relief, Government agencies that work with and grant funding to these organizations, and people who work "on the ground" at the various relief efforts, to gain insights on how organizations use their website and carbon calculator. From these interviews, we learned:
• The calculator has to be universally understood by anyone who wants to use it
• The end user doesn’t necessarily know what to do with the data
• The current way of calculating the data to show the benefit of transitioning to solar energy had to be upgraded
• Organizations want an easy way to get the data that they can take action on
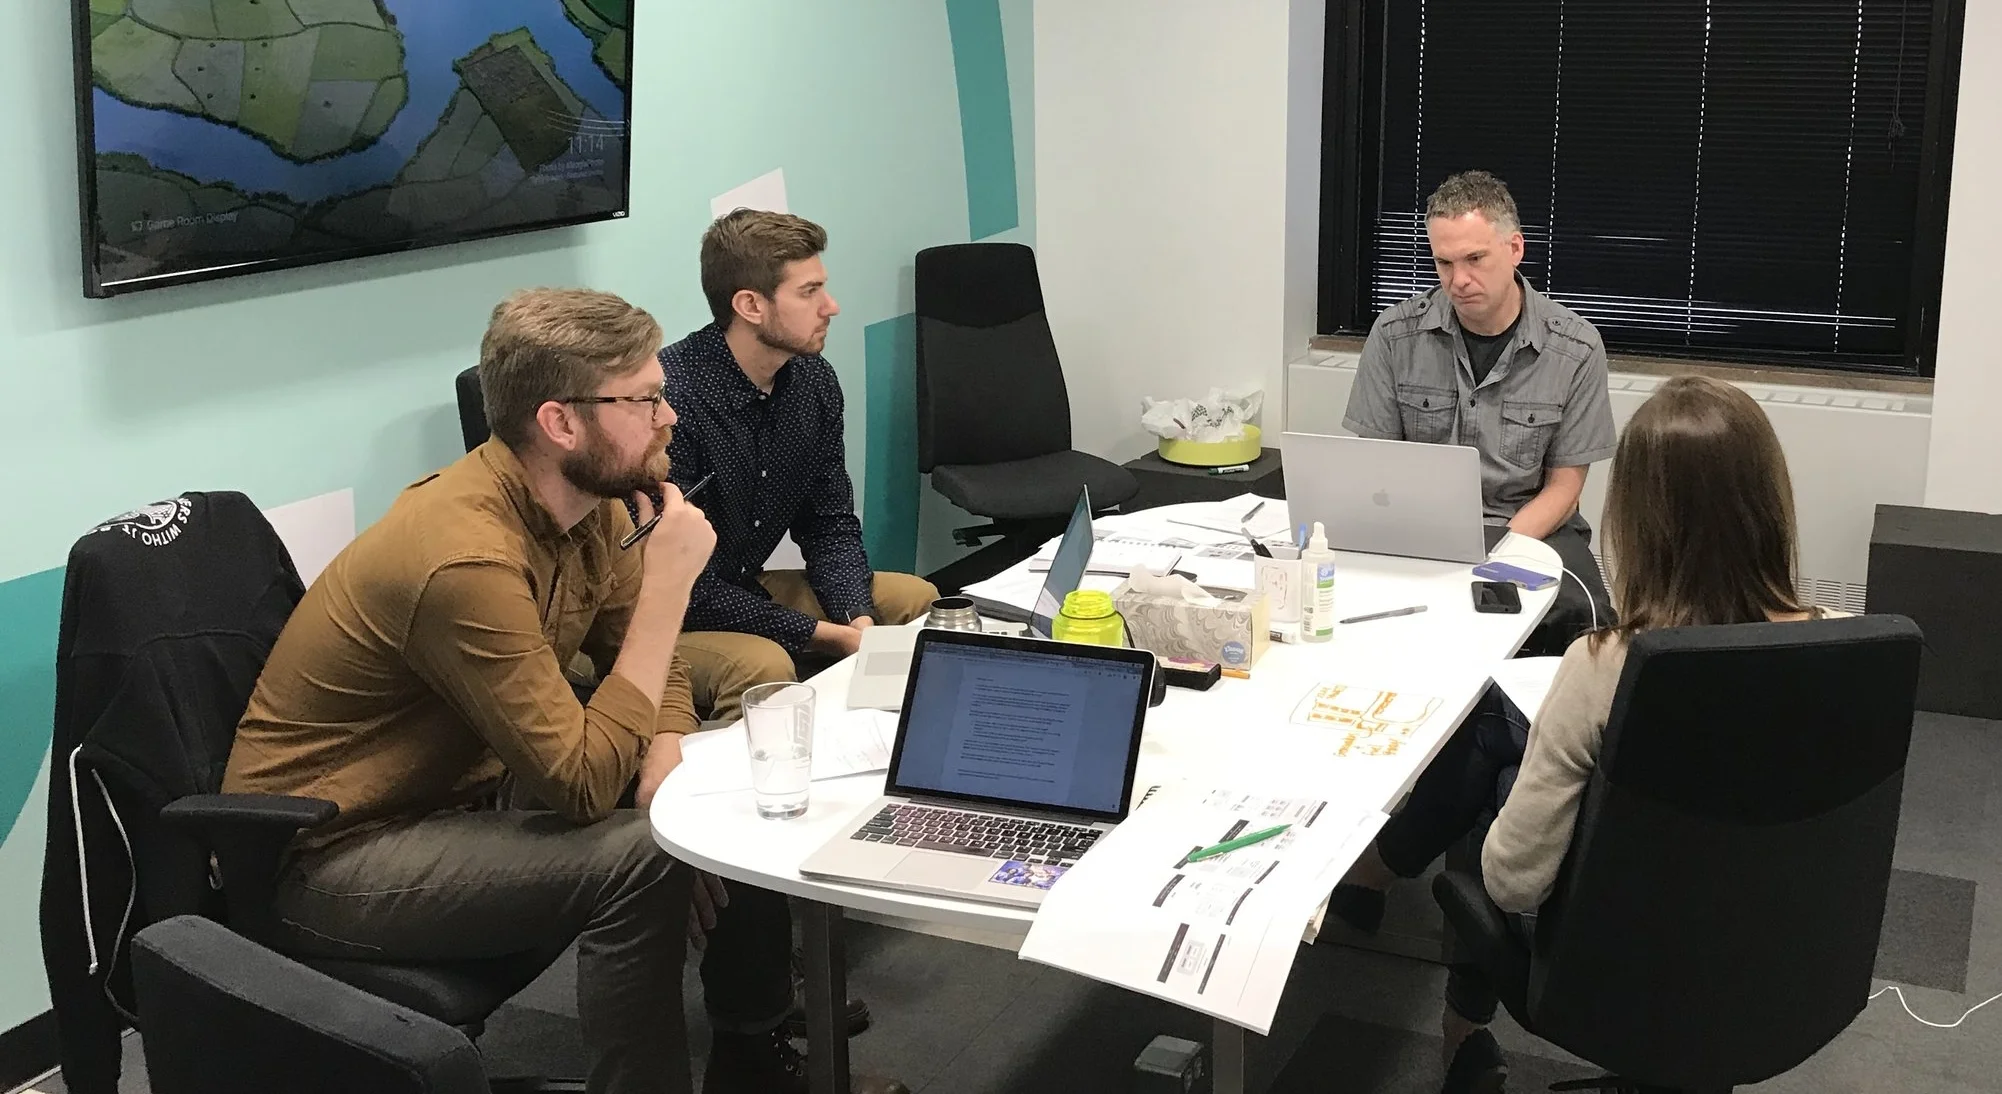
The Footprint Team conducting phone interviews
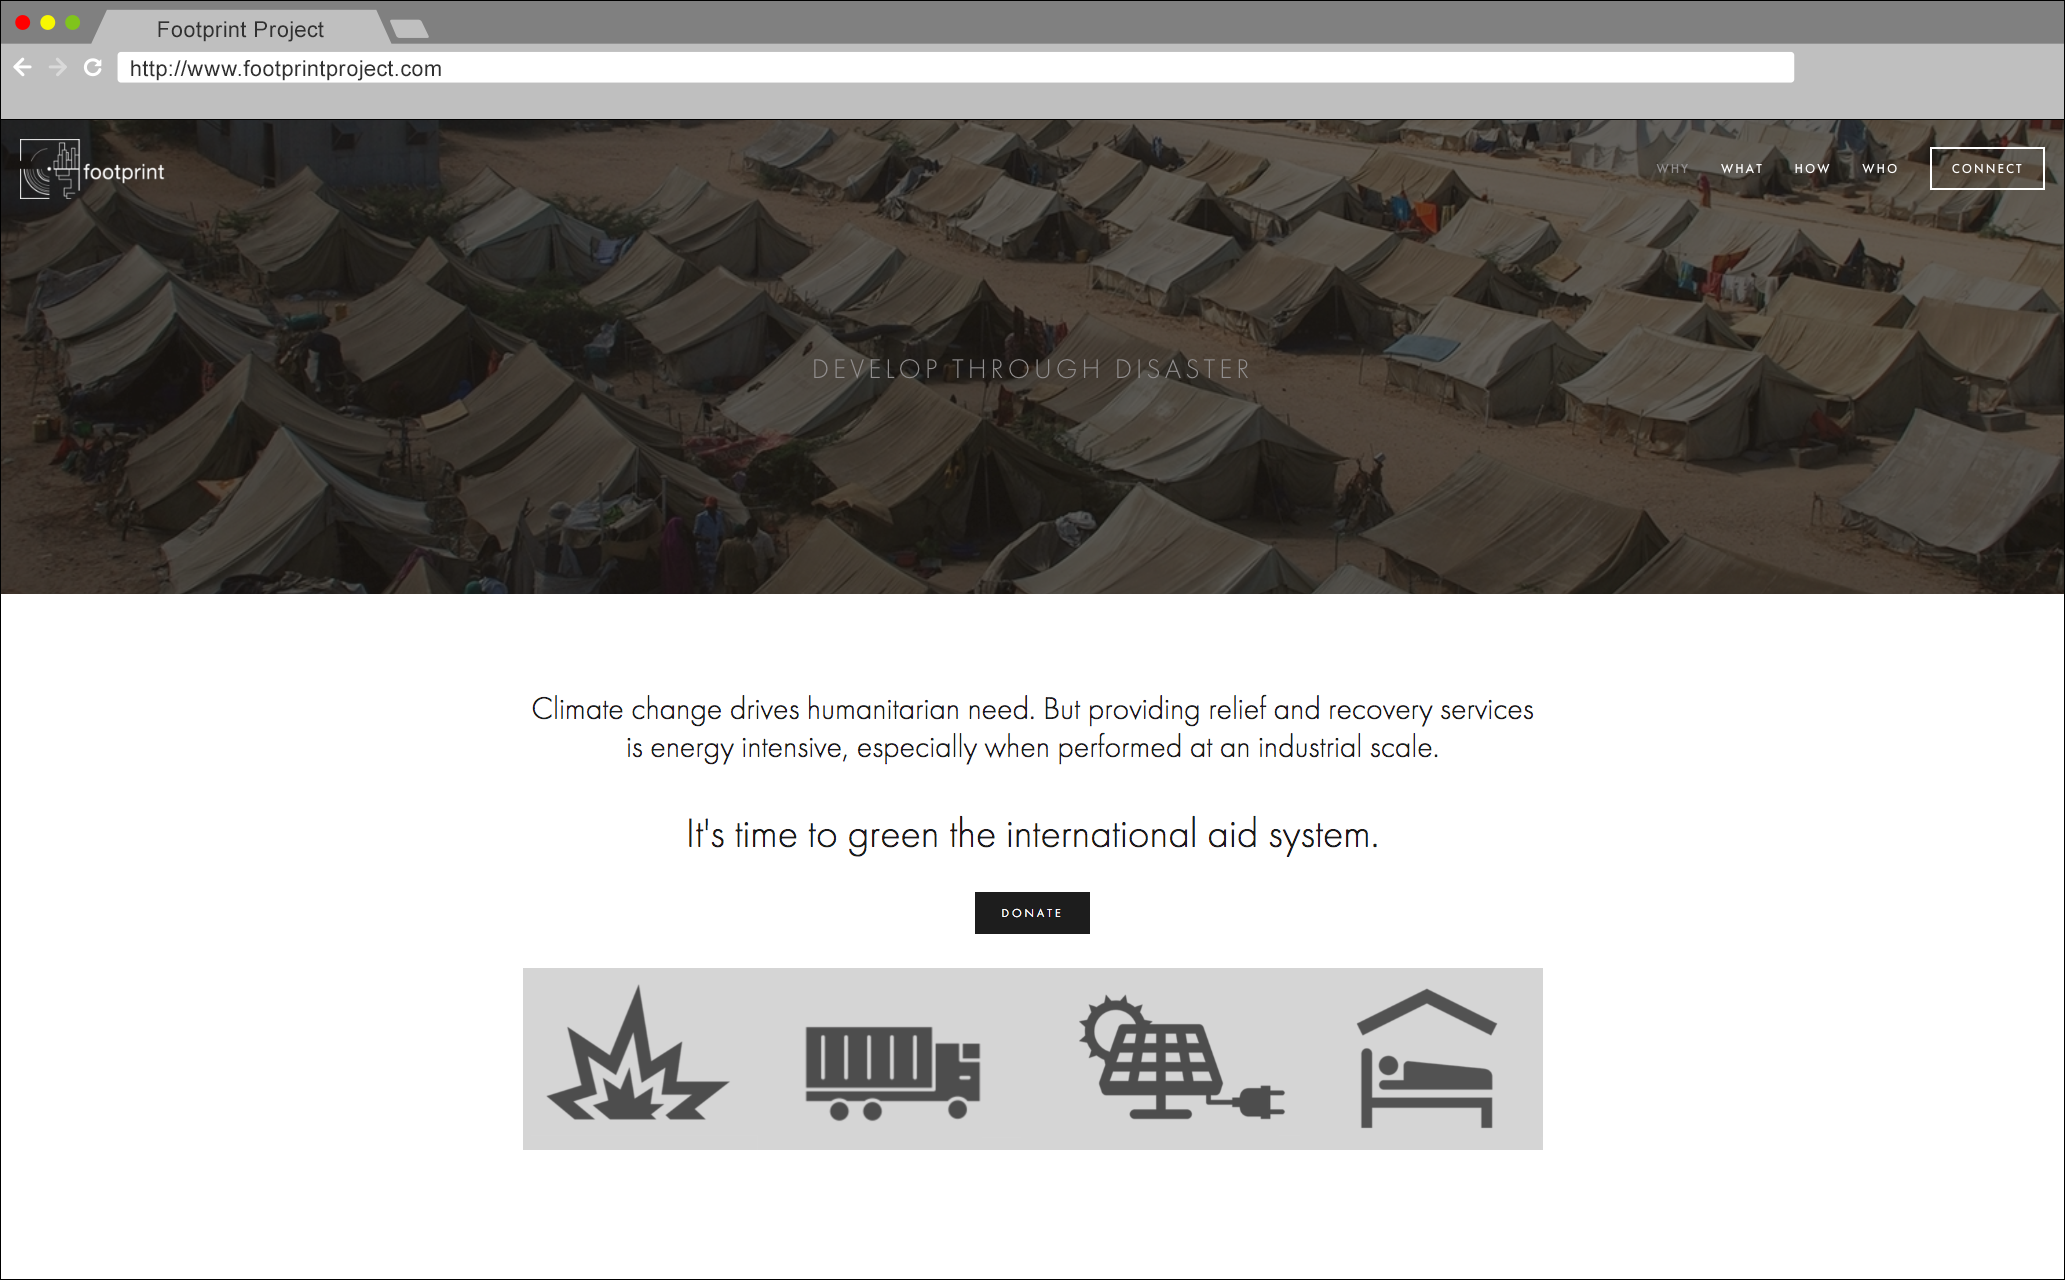
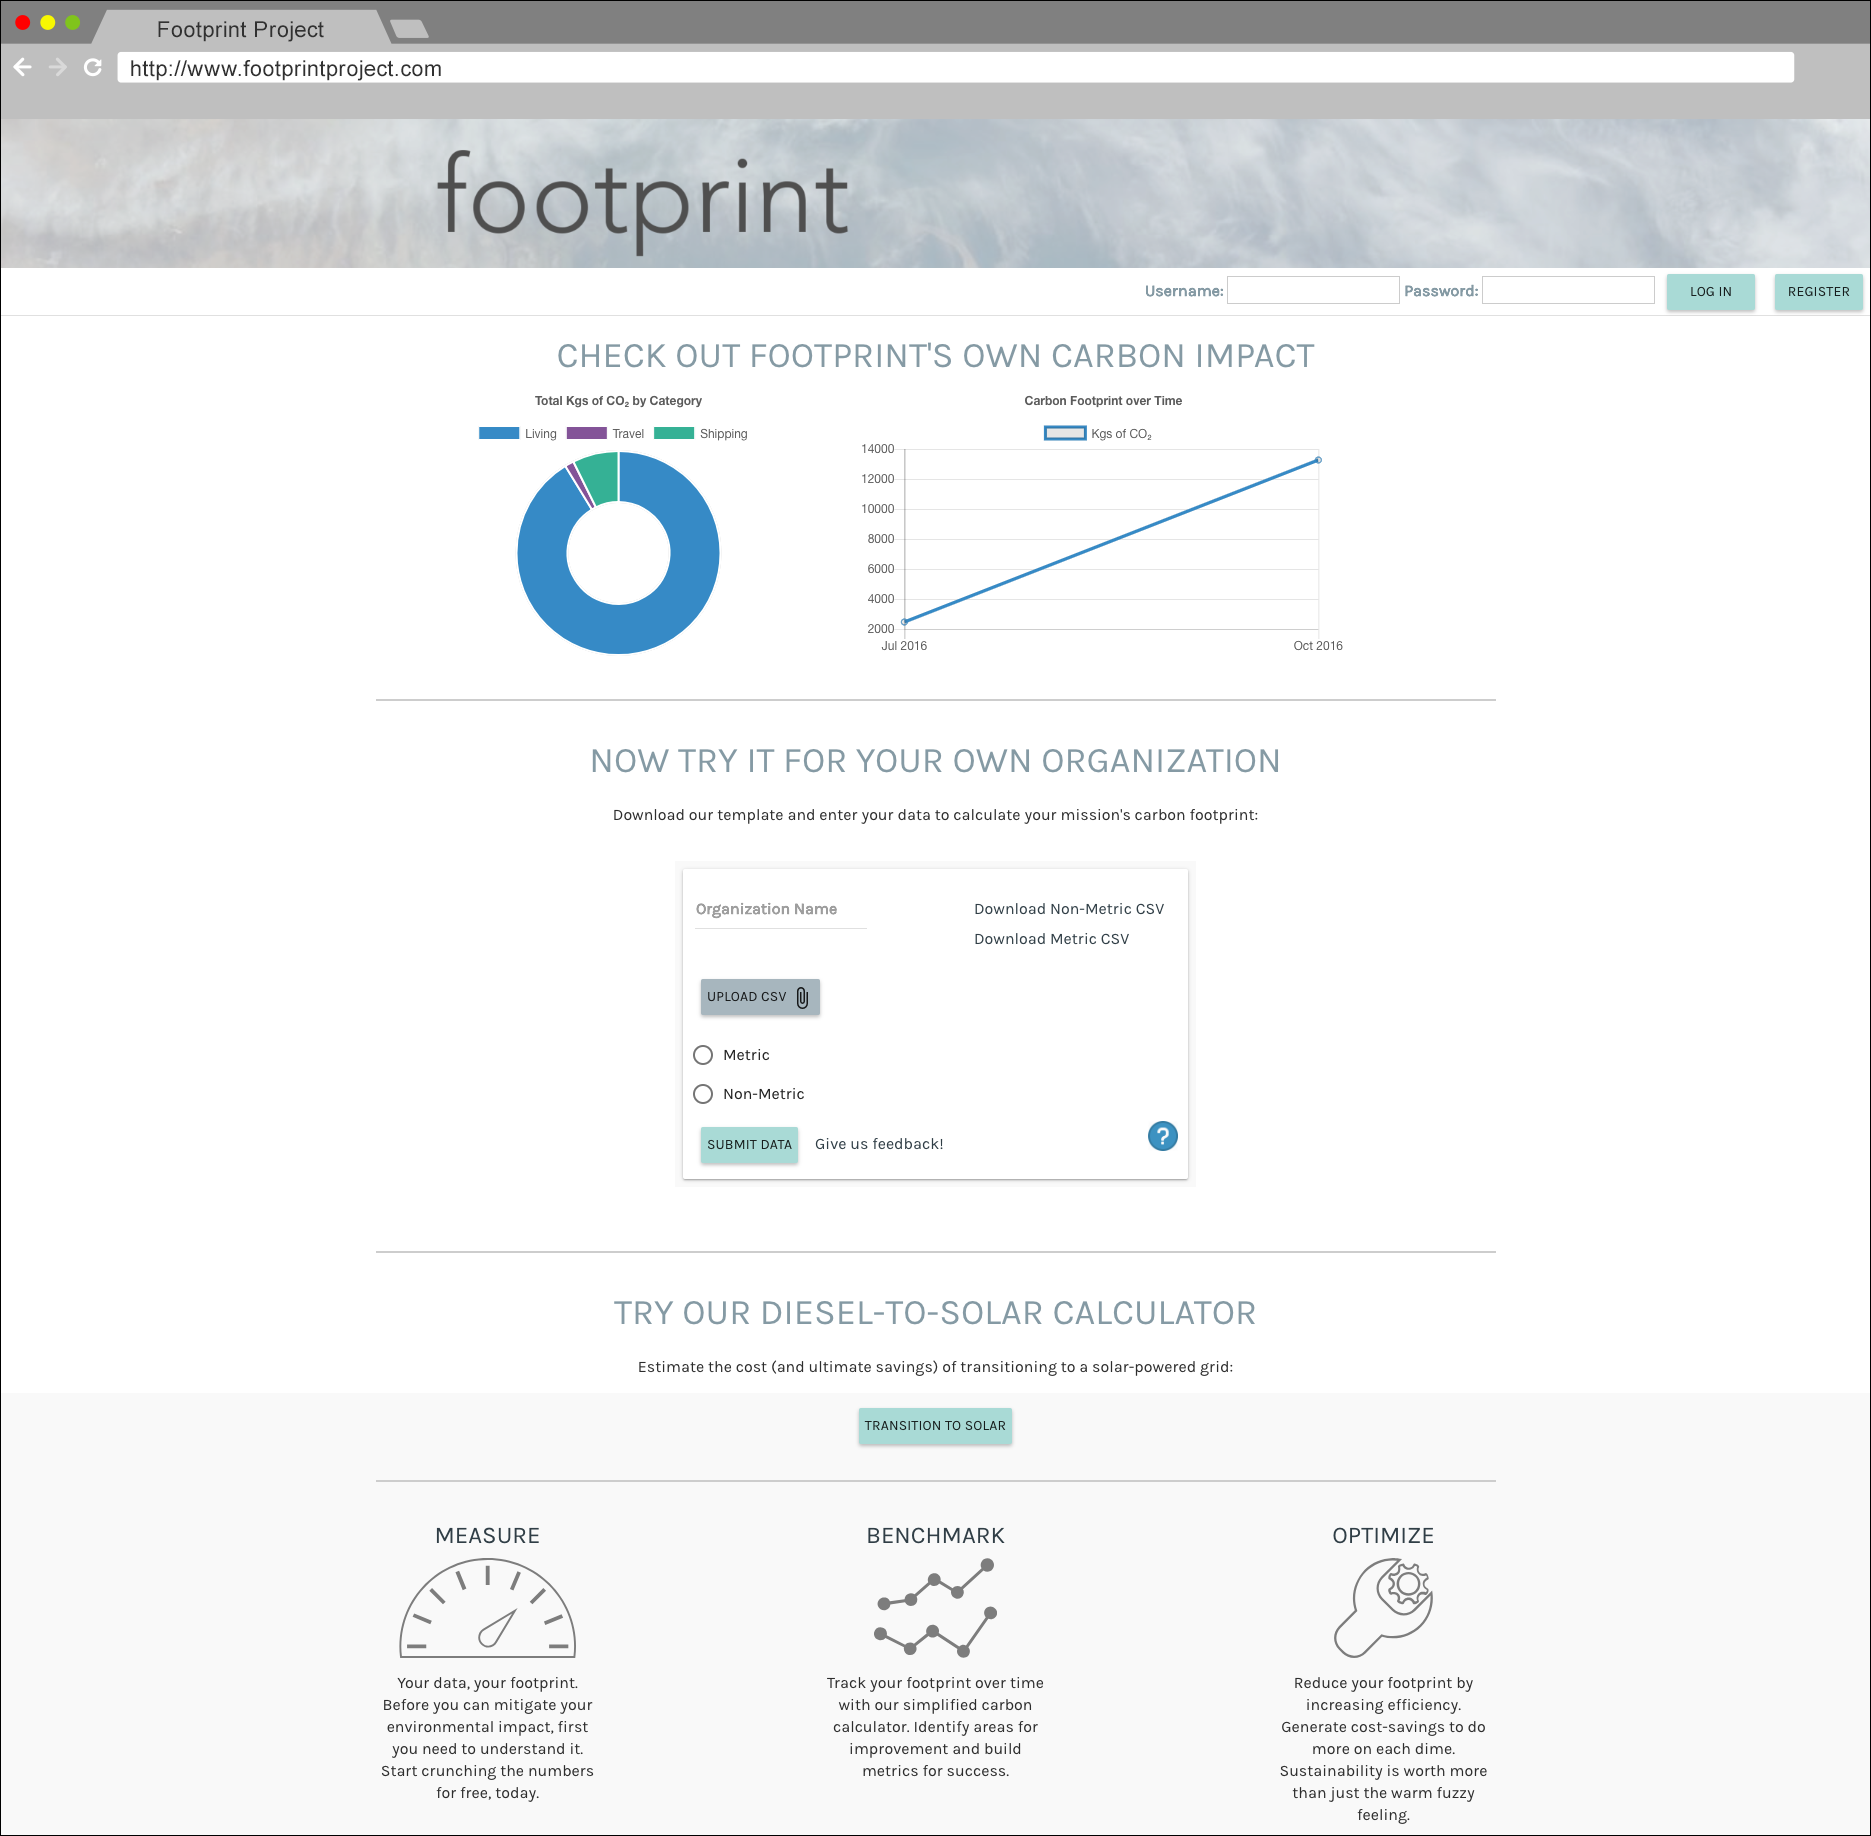
The before and after of the website and calculator
This was the current state of the website and calculator: inconsistent use of the logo, fonts and color. To help bring the calculator and the website into a unified web presence, I started by creating a new website template to help build consistency from page to page:
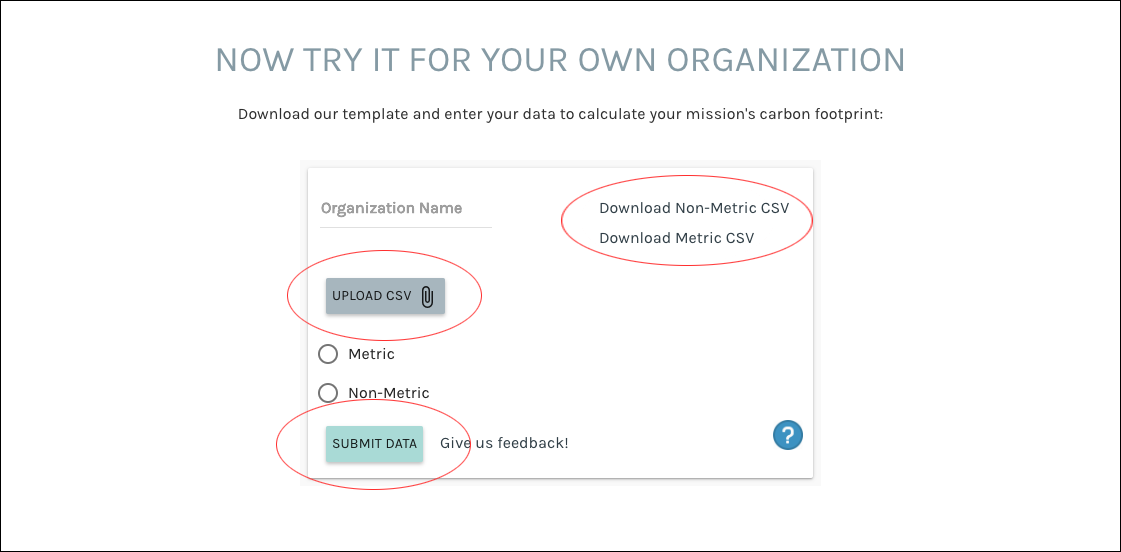
And then took a closer look at the calculator. I focused on the insight that the operation of it needed to be able to be easily understood. The calculator currently has no real directions on how to use it, and lacks sequence of what to do first, second, and has no visual indication of what is a button and what is a clickable link.
Knowing these challenges, I created a step by step process with instructions for using the calculator
After a user clicks the results button on the calculator, they are taken to this page with a view of their carbon footprint. One of the insights was that after getting the data from the calculator, the end user doesn’t know what to do with the data — to address that concern, creating a section with a call to action about the services that footprint can provide to help organizations make sense of the data.
Solar Power
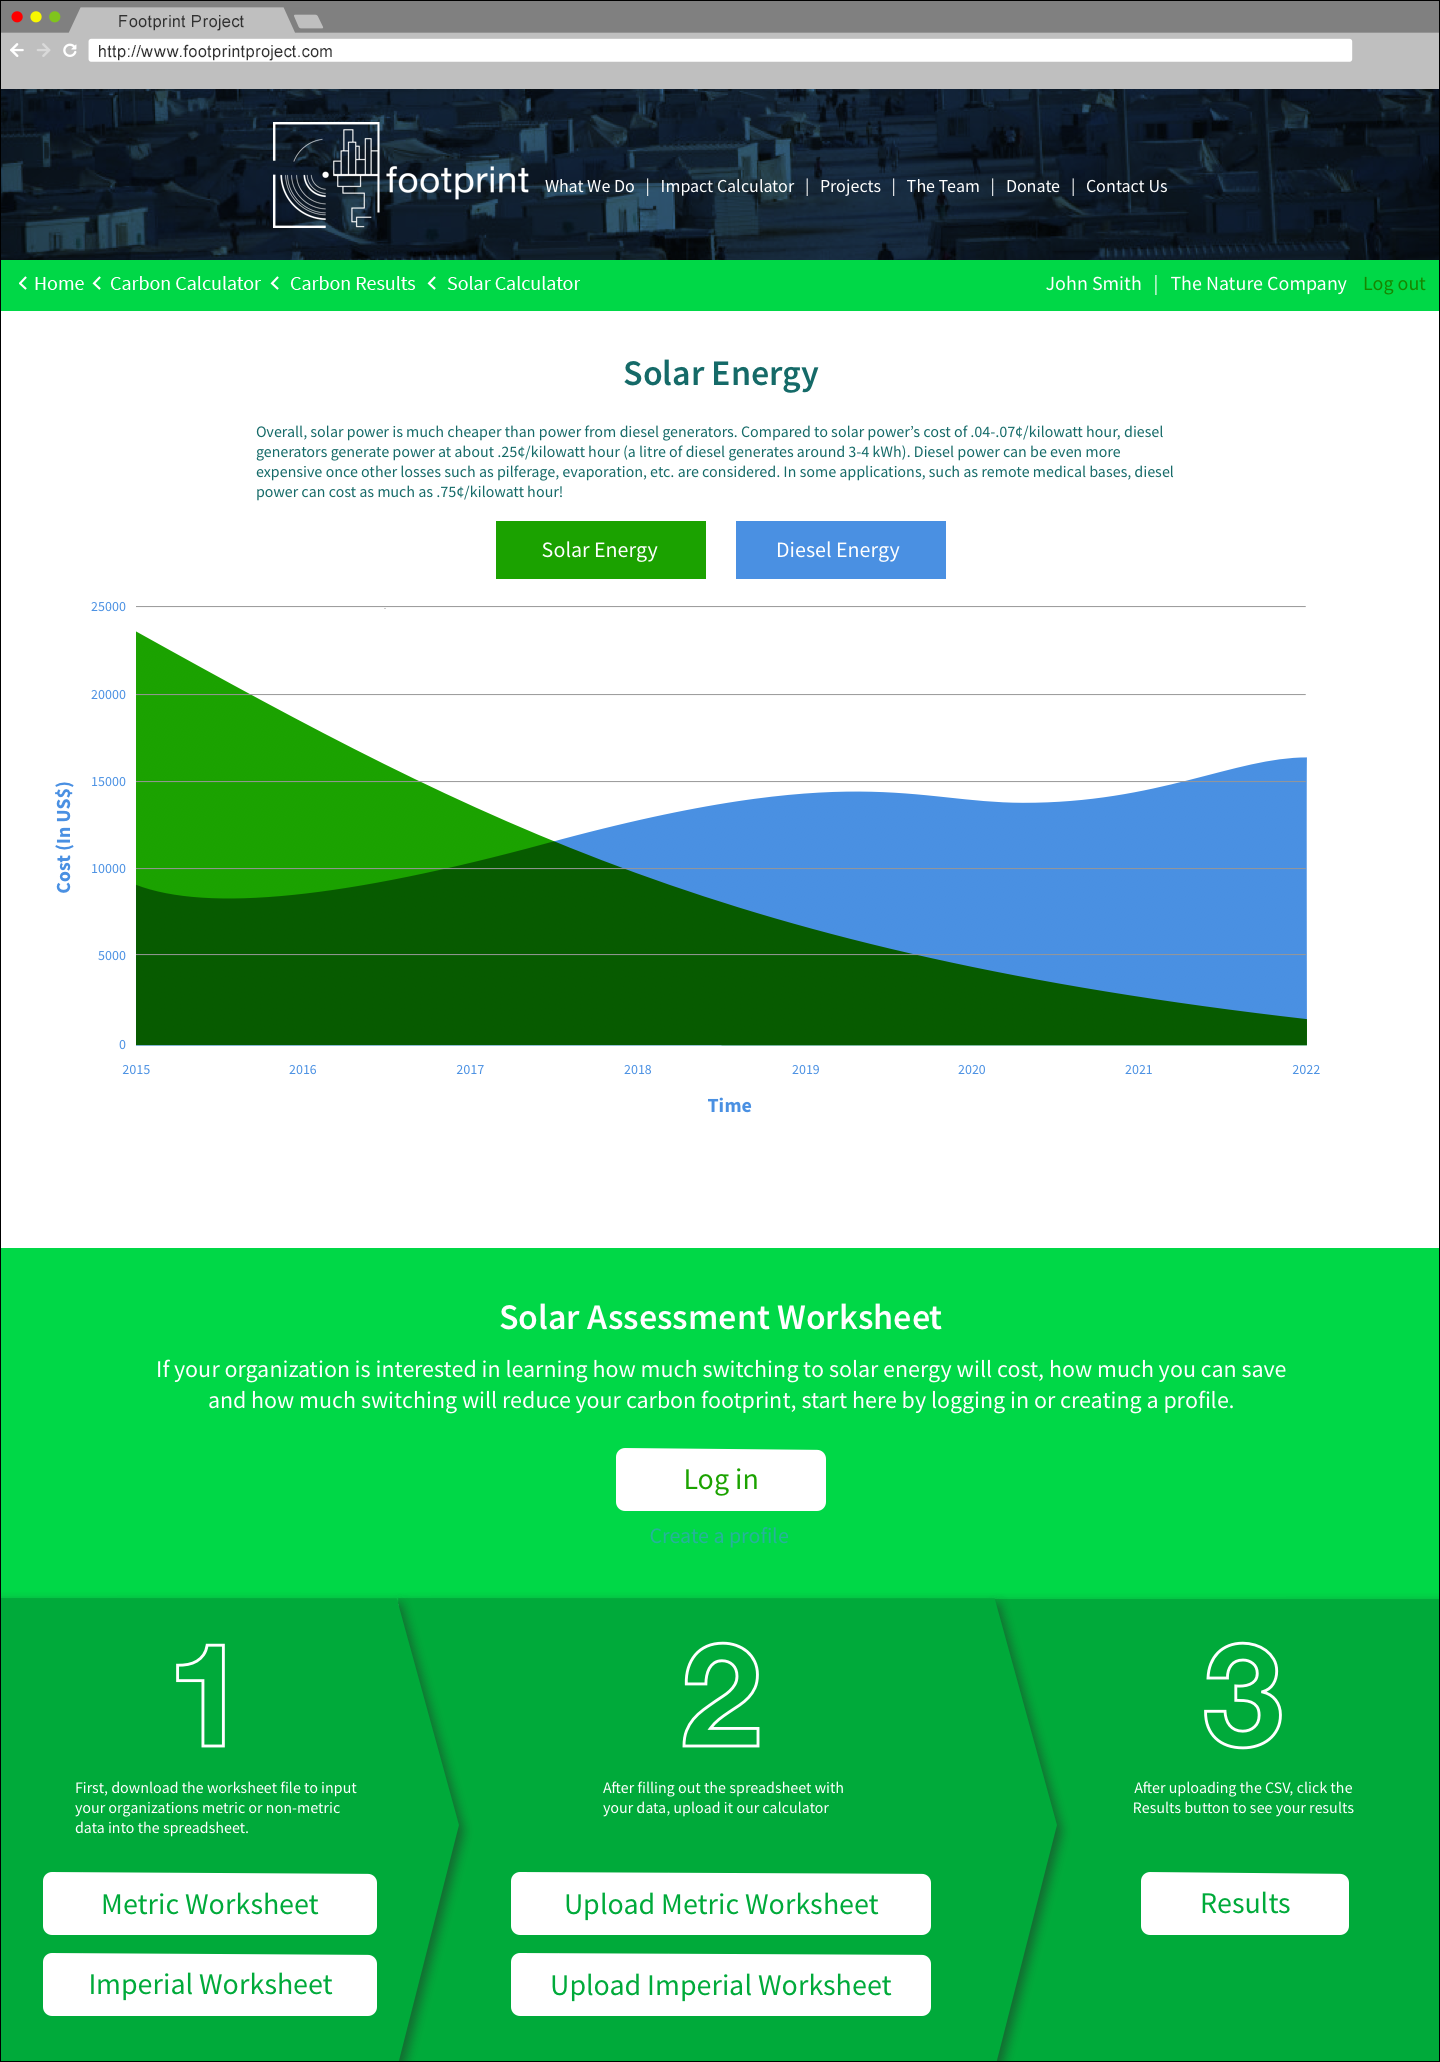
After assessing their carbon footprint, the user can then see the cost and savings of switching over to a solar power grid. Similar to the carbon calculator, the solar energy calculator uses the same steps and sequence to take in the data and produce the results.
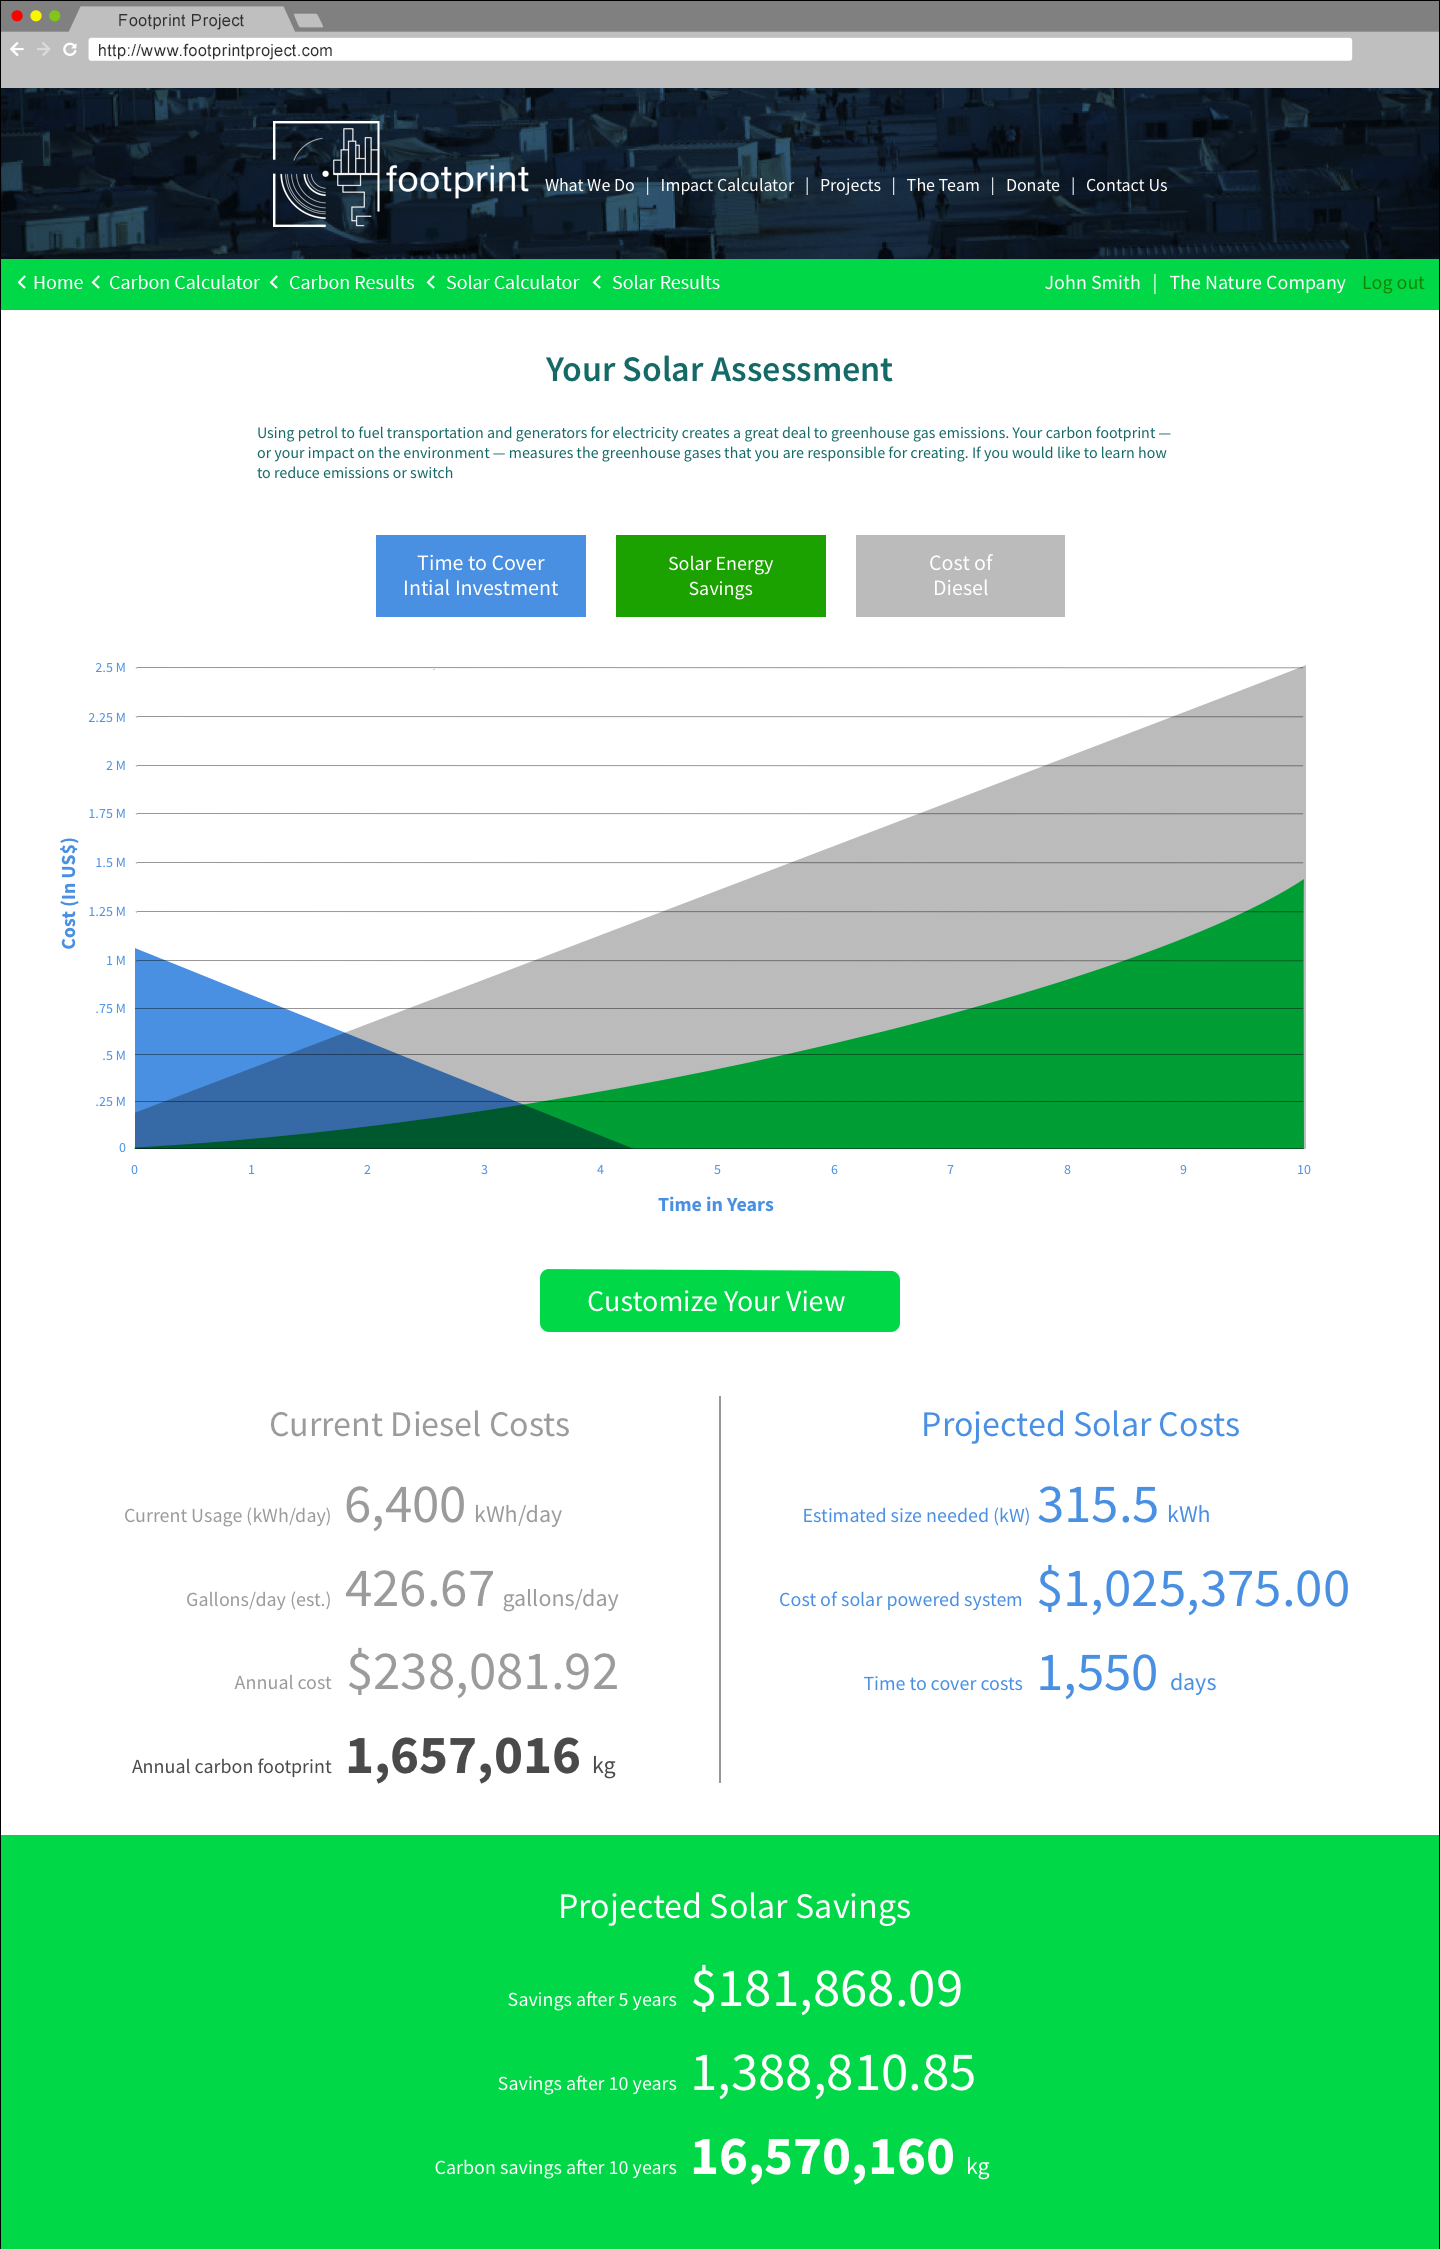
And just like the carbon calculator, the user is taken to a page that displays their results:
How much energy they are consuming, the cost of that energy and their current carbon footprint
The projected initial cost of switching to a solar powered grid
How long it would take to recover the initial cost of the solar grid
How much the user would save over a 10 year period (versus using diesel), as well as how much they would save on their carbon footprint
Future goals
To add in the ability to explain and use offset credits and resources to work with offset brokers
Content about the different levels/packages of Footprint’s services


